Download the comprehensive report : Link
Introduction
China’s transformation into the world’s second-largest economy over the past four decades is one of the most rapid industrializations in history. It has also produced environmental damage of corresponding magnitude and duration. At its peak between 2005 and 2015, air pollution in northern China regularly exceeded levels considered immediately dangerous to human health; independent studies estimate it caused between 1.6 and 2.2 million premature deaths annually. More than 60 % of monitored groundwater and roughly one-fifth of the country’s arable land have been classified as polluted, in many cases heavily, with cadmium, arsenic and other toxins entering the food chain.
For much of this period, official data were suppressed or manipulated, independent monitoring was obstructed, and environmental activists faced detention. Major policy shifts only arrived after sustained public anger in 2011–2013 forced the issue onto the political agenda. The 2013 Air Pollution Prevention and Control Action Plan and subsequent “war on pollution” produced undeniable results: nationwide PM2.5 concentrations fell approximately 57 % between 2013 and 2024, and hundreds of thousands of high-polluting factories and small coal boilers were closed or upgraded. Yet coal-fired power capacity continued to expand until 2023, total carbon emissions remain near all-time highs, and local governments have repeatedly been caught falsifying environmental data to meet central targets.
On the Tibetan Plateau and upper reaches of Asia’s great rivers, an accelerated programme of dam construction, mining and infrastructure development has altered fragile high-altitude ecosystems at a pace and scale with few modern parallels. These projects have triggered serious land degradation, disrupted traditional herding communities, and raised transboundary water concerns for ten downstream countries.
This report examines the full arc of China’s environmental crisis: the decades of unchecked pollution driven by growth-first policies, the coercive and often deceptive campaigns that eventually reduced some of the worst domestic impacts, and the continuing ecological costs now being externalised onto sensitive border regions and neighbouring states. It concludes that, despite genuine recent improvements in certain indicators, the fundamental governance model-centralised, opaque, and intolerant of independent oversight-continues to prioritise short-term economic and strategic objectives over long-term environmental security.
Industrialization, economic growth, and pollution in China
China’s breakneck industrialization since the 1980s-often prioritized above all else under a growth-first policy framework-lifted hundreds of millions out of poverty but transformed the country into the world’s largest polluter, with environmental degradation imposed on its citizens for decades with minimal accountability. Coal-fired power and heavy industry, long shielded by local governments and state-owned enterprises, drove explosive increases in air, water, and soil contamination until public health crises and social unrest finally forced a policy pivot in the mid-2010s. Even today, despite undeniable reductions in some pollutants, China remains the dominant source of global greenhouse gases, continues to expand coal capacity at a record pace, and grapples with entrenched water and soil pollution that threatens food security and public health.
Air Pollution
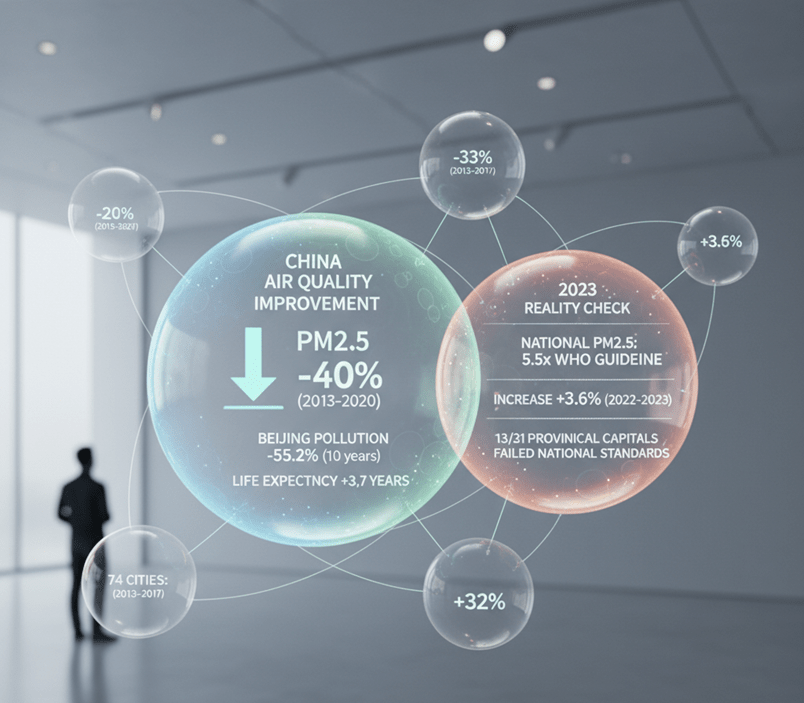
- Between 2013 and 2020, harmful particulates (PM2.5) in China’s air fell by about 40%, with the average PM2.5 concentration dropping by 33% from 2013–2017 in 74 major cities.
- Beijing exemplifies the shift: PM2.5 dropped from 89.5 μg/m³ (2013) to ~33 μg/m³ (2024), adding an estimated 3–4 years to average life expectancy (University of Chicago AQLI).
- Yet these “gains” started from levels no developed nation has ever tolerated for decades. In 2024, China’s national PM2.5 average remained nearly 6 times the WHO guideline of 5 μg/m³, and a quarter of cities still fail domestic standards (In 2023, 13 of 31 provincial capitals failed to meet China’s national standards for PM2.5, indicating persistent regional challenges).
- A troubling rebound occurred in 2023 (+3.4–3.6% year-on-year), the first increase since 2013, driven by industrial recovery and lax enforcement. Improvements resumed in 2024, but progress has slowed dramatically (only -2.7% y-o-y) and remains vulnerable to data manipulation scandals and local protectionism.
Greenhouse Gas Emissions
- China’s contribution to the world’s greenhouse gas emissions is staggeringly large, accounting for an enormous 25.29% of the global total.
- China is emitting more CO₂ annually than the US, EU, and India combined.
GHG Emissions of G20 Countries (2022)
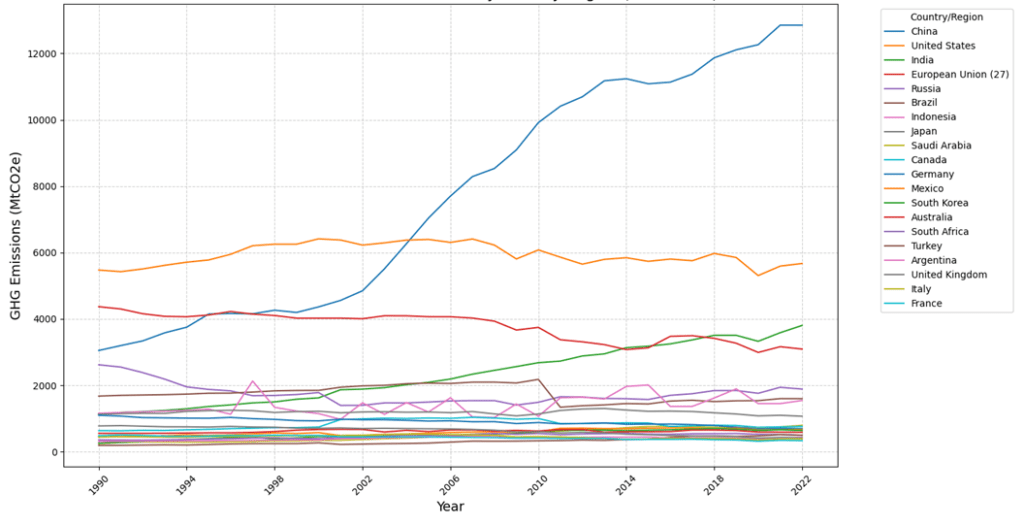
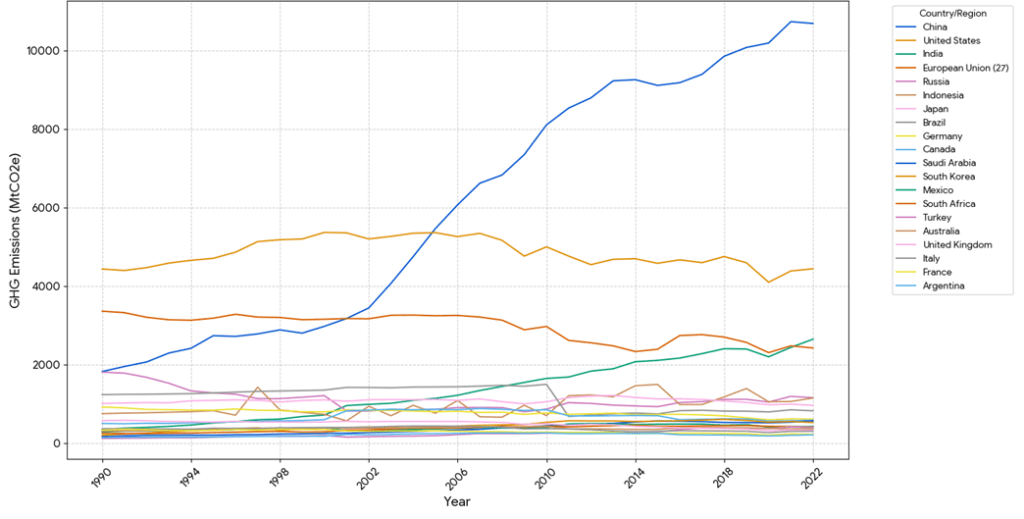
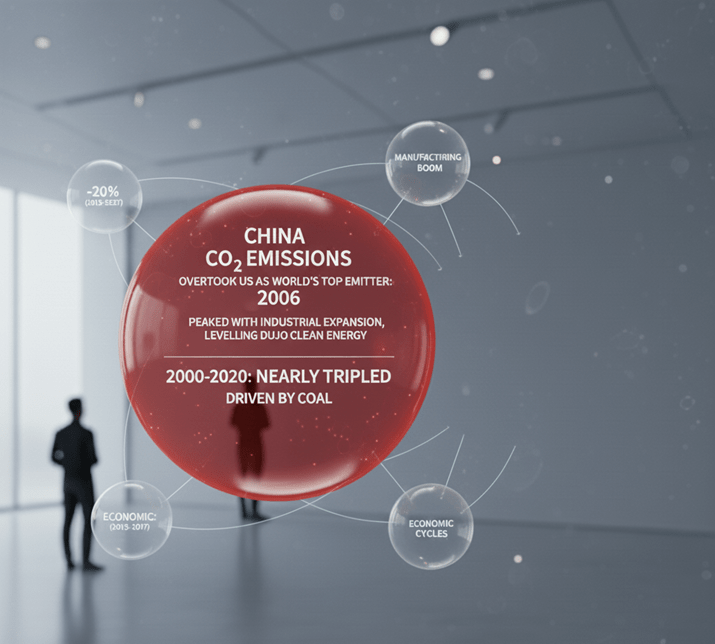
- China’s annual CO₂ emissions rose rapidly during its manufacturing boom, overtaking the US as the world’s top emitter in 2006.
- Year-on-year changes in emissions reflected economic cycles, peaking with industrial expansion and levelling off more recently due to clean energy policies.
- From 2000 to 2020, total annual emissions nearly tripled, driven by coal combustion for energy and industry.
Coal Dependency: The Global Climate Roadblock
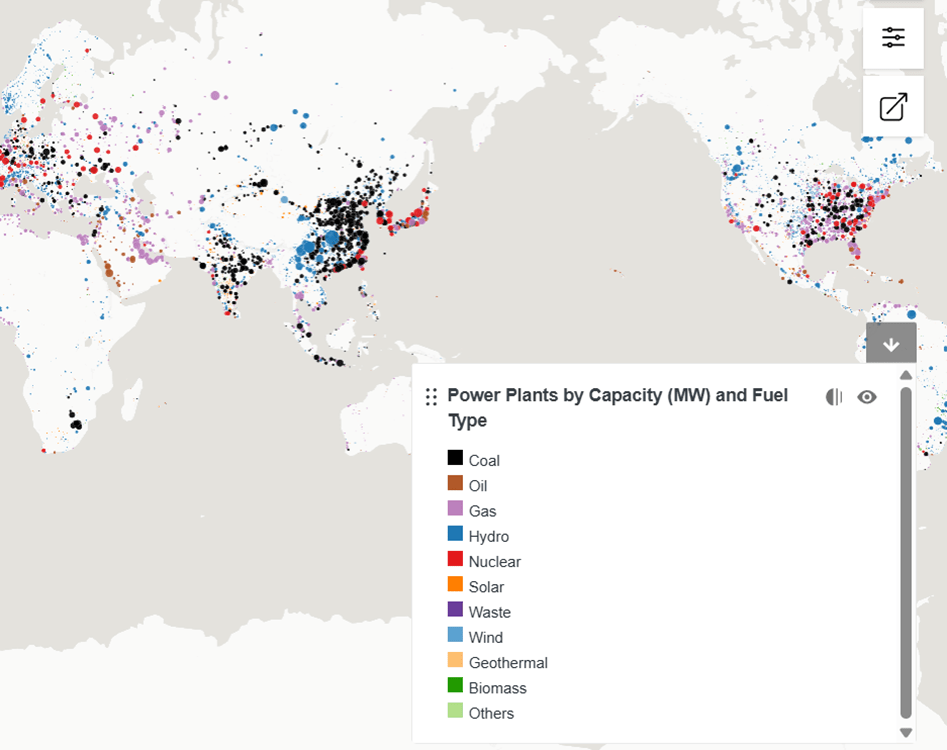
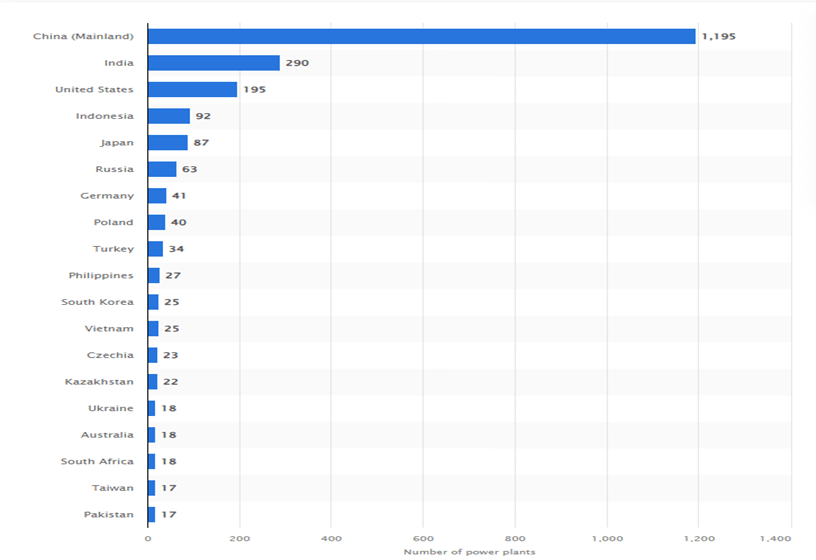
China remains the epicentre of global coal dependency, operating an unparalleled fleet that dwarfs the rest of the world combined and continues to expand despite record renewable deployment. As of mid-2025, mainland China hosts approximately 1,195 operational coal-fired power plants-nearly half of the global total of around 2,400–2,500 units and more than four times the number in India (second place with ~290). This dominance appears starkly in global power-plant mapping, where dense clusters of black dots (representing coal) blanket eastern and northern China, while the United States, Europe, and most other regions show far sparser and declining coal infrastructure amid widespread retirements.
Although China has achieved explosive growth in wind and solar-adding over 500 GW of clean capacity expected in 2025 alone, pushing coal’s share of electricity generation down to a nine-year low of ~51% in mid-2025-the country commissioned ~21 GW of new coal capacity in the first half of 2025 alone. Construction starts hit 46 GW in the same period, with projections of 80–100 GW coming online for the full year, the highest pace since 2015–2016.
This ongoing coal binge, driven by provincial approvals and energy-security concerns rather than actual power shortages in many regions, offsets global phase-out efforts elsewhere and keeps China responsible for over half of worldwide coal-fired generation. The result is a deeply entrenched structural dependency that undermines Beijing’s own pledges to “strictly control” coal growth through 2025 and begin phasing it down thereafter, locking in decades of excess capacity and emissions even as renewables increasingly marginalise coal’s role in day-to-day power supply.
Countries and territories with the largest number of operational coal power plants worldwide as of July 2025:
Ozone (O₃) Pollution in China: A Growing Threat to Air Quality, Food Security, and Carbon Sinks
China’s near-surface ozone pollution has emerged as one of the country’s most serious and intractable environmental challenges. Once overshadowed by PM2.5-dominated haze, O₃ is now the primary pollutant on more days than fine particles in many regions. Between 2010 and 2021, ozone levels rose rapidly across the country, peaking around 2019–2020, and remain far above WHO guidelines despite recent slight declines. (Shi et al. (2025). Synergistic and Trade-Off Influences of Combined PM2.5-O₃ Pollution in the Shenyang Metropolitan Area, China: A Comparative Land Use Regression Analysis. Sustainability 17(17):8046. https://doi.org/10.3390/su17178046)
Current Status and Hotspots
- Nationally, the annual 90th-percentile maximum daily 8-h average (MDA8) O₃ concentration increased from ~130 µg/m³ in 2010 to a peak of ~170 µg/m³ around 2019–2020, then stabilised or slightly declined in some areas.
- The most severe and persistent O₃ pollution occurs in four major clusters:
- North China Plain (Beijing–Tianjin–Hebei and southern Hebei, Shandong, Henan)
- Yangtze River Delta
- Pearl River Delta
- Sichuan Basin
- Emerging high-O₃ zones now include the Fenwei Plain (Shanxi–Shaanxi) and parts of Northeast China (Shenyang Metropolitan Area).
Combined PM2.5–O₃ Pollution: Synergies and Trade-offs
Recent land-use regression (LUR) studies in the Shenyang Metropolitan Area (Shi et al., Sustainability 2025) reveal complex interactions between PM2.5 and O₃:
- Synergistic factors (same directional effect on both pollutants)
- Tree cover and grassland reduce both PM2.5 and O₃
- Built-up area and permanent water bodies increase both
Trade-off factors (opposite directional effect)
- Longitude (eastward), elevation, population density, NO₂ column, and aerosol optical depth (AOD) higher PM2.5 but lower O₃
- Across the metropolitan area, PM2.5 dominates combined pollution in 47 % of the area, while O₃-dominant zones are rare (4 %) and localised.
Spatially, PM2.5 still drives most “compound pollution” episodes in northern megacity clusters, whereas summer O₃ episodes increasingly dominate in southern and eastern coastal regions.
Impacts on Wheat Yield and Forest Productivity (2010–2021)
A comprehensive national assessment (Wang et al., Environmental Pollution 2023) using new meteorology-inclusive metrics (O₃MET for wheat, O₃RH for forests) quantified unprecedented ecological damage:
- Wheat (almost entirely winter wheat)
- Average annual yield loss: 26.5 million tonnes (17 % of potential yield without O₃ damage)
- Annual economic loss: ~US$ 11–15 billion
- Loss increased at 1.8 Mt/yr over the 12-year period
- Heaviest relative losses (>25 %) in Henan, Shandong, Anhui, and Jiangsu -the core of China’s “breadbasket”
Forests (gross primary productivity, GPP)
- Average annual GPP loss: 552.6 TgC (equivalent to ~4 % of total forest carbon uptake)
- Loss increased at 13.9 TgC/yr
- Highest absolute losses in subtropical and temperate forests of East and South China
Dual high-impact zones where both wheat and forests suffer severe O₃ damage are concentrated in the North China Plain and middle–lower Yangtze region, exactly the areas with the highest population density, food production, and carbon-sequestration potential.
Drivers of Rising Damage
The study attributes ~70–80 % of the increasing losses to rising ambient O₃ concentrations, with the remainder due to unfavourable meteorological shifts (warmer, drier conditions that enhance stomatal uptake). This confirms that emission-driven O₃ increases, not just climate variability, are the primary culprit.
Policy Implications
- Ozone is no longer just an urban air-quality issue; it is now a major threat to national food security and carbon-neutrality goals.
- The eastern agricultural heartland faces a “triple burden”: severe O₃ health effects, wheat yield losses, and forest carbon-sink weakening.
- Current NOx- and VOC-control measures have slowed the rise but are insufficient to reverse damage; deeper cuts (especially in NOx from transport and industry) are urgently needed.
- Vegetation-based mitigation (tree cover, grasslands) offers co-benefits for both PM₂.₅ and O₃, but must be carefully designed to avoid excessive biogenic VOC emissions in warm, high-NOx environments.
In summary, ozone has replaced PM2.5 as China’s most costly air pollutant when ecological and agricultural impacts are fully accounted for. Without accelerated precursor emission reductions, projected O₃ levels through 2030–2050 will continue eroding wheat yields and forest carbon uptake at rates that jeopardise both food-security and climate targets.
Water and Soil Pollution: A Persistent and Largely Unaddressed Legacy
China’s decades of unchecked industrial expansion have left behind a toxic inheritance in its soil and water resources that remains one of the most severe on the planet. A 2014 national soil survey-whose full results were kept secret for years-revealed that 16.1 % of sampled sites (and 19.4 % of arable land) were contaminated, primarily with cadmium, mercury, arsenic, and lead. Independent follow-up studies suggest the real figure may exceed 20 %. By 2020 the Ministry of Ecology and Environment acknowledged more than 200,000 contaminated brownfield sites, concentrated in the eastern manufacturing heartland of the Yangtze and Pearl River deltas. Remediation has been slow, expensive, and largely limited to high-profile urban projects; vast areas of farmland continue to produce rice and vegetables with heavy-metal levels that exceed national food-safety limits.
Water pollution follows a similar pattern. Despite the 2015 “Water Ten Plan” and billions of yuan invested, as of 2024 roughly 15–20 % of monitored surface-water sections still fail to meet even the lowest grade for human contact (Grade V or worse). In the North China Plain, up to 80 % of shallow groundwater is unfit for drinking without treatment. Industrial clusters in Hebei, Shandong, and Henan continue to discharge untreated or inadequately treated wastewater, while lax enforcement and falsified monitoring data remain commonplace. The human and ecological cost is evident in the persistence of “cancer villages” along heavily polluted rivers and in the collapse of fisheries in lakes such as Taihu and Chao.
Microplastic Pollution in the Yellow River Basin: Focus on the Wuding River
A 2024 study (Wan S, Xu G, Xiong P, et al. Microplastic pollution characteristics and ecological risk assessment in the Wuding River Basin, China. Environmental Pollution. 2024;356:124228. https://doi.org/10.1016/j.envpol.2024.124228) in the Wuding River (WDR), the largest sand-carrying tributary of the middle Yellow River, revealed widespread microplastic (MP) contamination across its 491 km length (Wan et al., 2024).
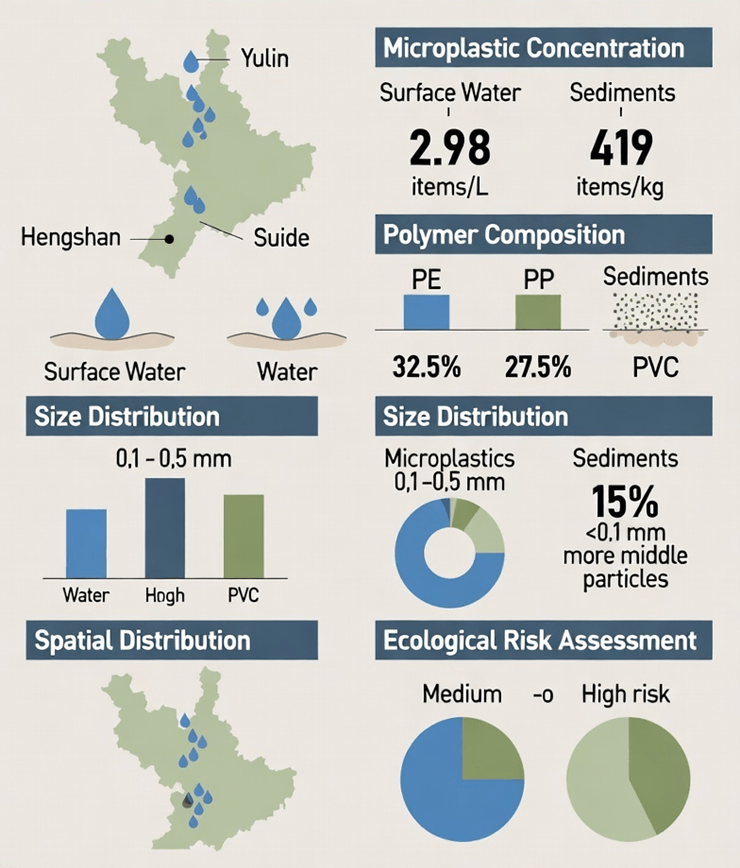
Key findings:
- Surface water: average 2.98 items/L (range 1.02–10.29 items/L)
- Sediments: average 419 items/kg (range 120–1450 items/kg) -significantly higher than surface water
- Dominant polymers: PE (32.5%) and PP (27.5%) in water; more high-density fragments (e.g., PVC) trapped in sediments
- Smallest MPs (<0.1 mm) were 15% more abundant in sediments than water, due to settling of denser and finer particles
- Urban areas (Hengshan, Yulin, Suide) showed peak concentrations in surface water, linked to wastewater and land-use impacts
- Sediments in middle and lower reaches posed medium to high ecological risk, with PVC identified as the primary risk contributor
The study highlights that sandy, high-sediment rivers like the WDR act as major MP sinks, with fine sediments and low-flow zones enhancing retention and long-term accumulation -making the Yellow River Basin a previously under-recognized hotspot for microplastic pollution in inland China.
Manghe River Watershed (Jiyuan City) – Soil Heavy-Metal Catastrophe
A October 2025 peer-reviewed study published in PLOS ONE (https://journals.plos.org/plosone/article?id=10.1371/journal.pone.0335016#sec009) on the Manghe River watershed in Jiyuan City -one of China’s largest lead-zinc smelting and coal-intensive industrial hubs -exposes alarming levels of soil heavy-metal contamination that highlight systemic environmental governance failures across Chinese industrial zones.
Key findings:
- Cadmium concentrations averaged 46.4× the Henan provincial background value
- Lead 4.85× higher
- Mercury 3.52× higher
- Industrial & mining storage lands recorded severe pollution (PLI = 6.6)
Distribution of soil heavy metal:
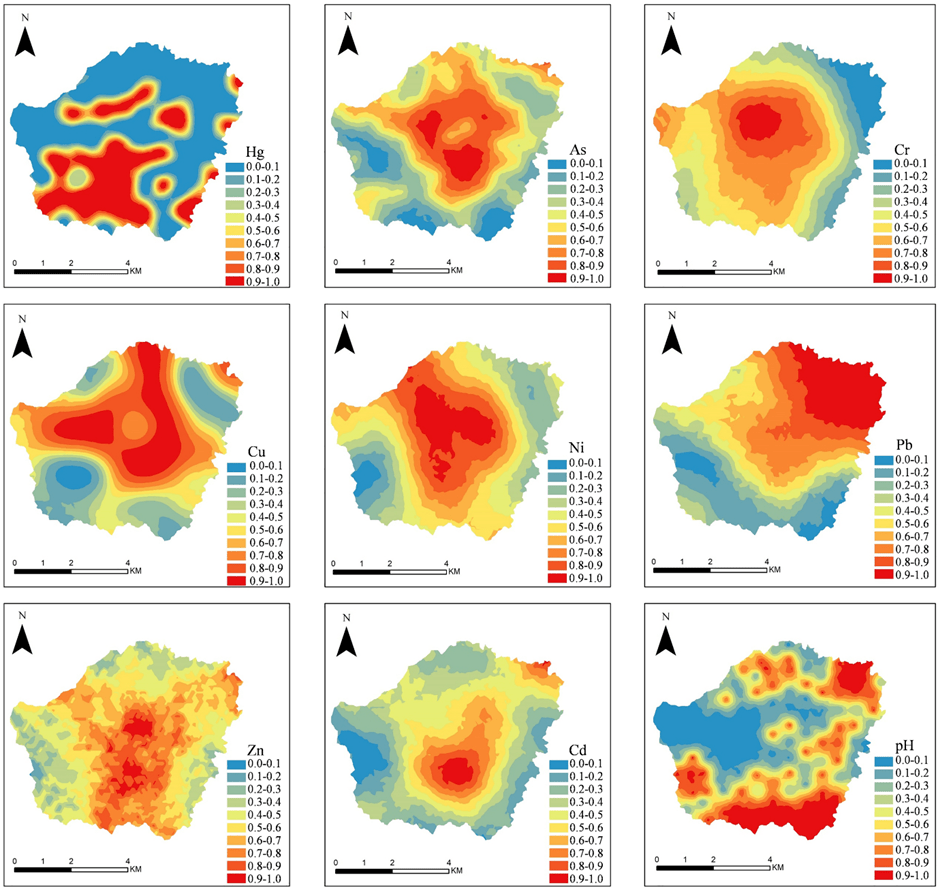
Spatial mapping revealed clear toxic hotspots radiating from smelters and waste sites, confirming that decades of lax regulation, inadequate waste treatment, and continued coal reliance have transformed once-productive farmland into poisoned zones where cadmium-laced rice and mercury accumulation directly threaten food security and public health.
The Manghe watershed is not an isolated case -it is a textbook example of a pattern repeated across hundreds of Chinese industrial clusters, where GDP-first policies have consistently overridden enforceable environmental protection, leaving a multi-decade toxic legacy that will cost billions of yuan and generations to clean up.
Read about the Heavy Metal Contamination in the Dianchi Lake Basin: Lakes More Polluted than Rivers, Xianyang Groundwater (Shaanxi Province) – Hexavalent Chromium Crisis and Per- and Polyfluoroalkyl Substances (PFAS) – China’s “Forever Chemicals” Crisis in the Comprehensive Report: Link
Imidacloprid (IMI) – China’s Most Ubiquitous and Unregulated Neonicotinoid Poison
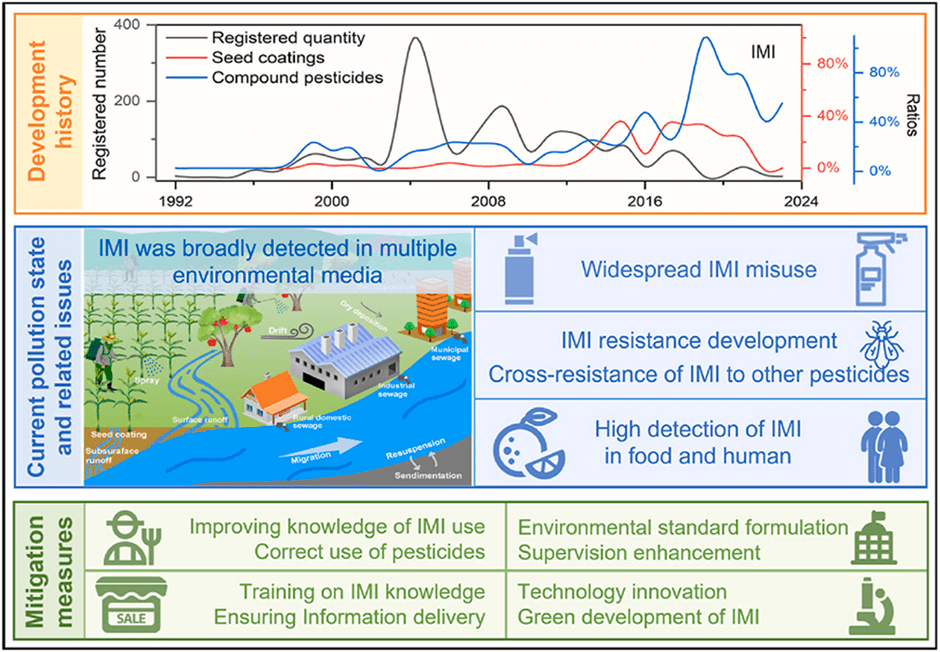
A January 2025 review published in Environmental Pollution (Volume 365, 125394, Source: https://www.sciencedirect.com/science/article/abs/pii/S0269749124021110) delivers a damning indictment of imidacloprid (IMI) -the world’s most-used neonicotinoid insecticide and the flagship product of China’s pesticide industry. Despite being banned or severely restricted across the European Union since 2018–2019 for its devastating effects on pollinators, IMI remains essentially unregulated in China and continues to see rising use.
Key findings from the meta-analysis of hundreds of Chinese studies: IMI is detected in over
- 90 % of agricultural soils (average 54.6 ± 83.8 ng/g dw);
- 81 % of surface waters (average 32.8 ± 103 ng/L) &;
- 84 % of sediments (average 1.7 ± 2.9 ng/g dw) nationwide.
Concentrations in major rivers routinely exceed chronic aquatic-life benchmarks set by the USA (10 ng/L) and the Netherlands (8.3 ng/L) -e.g., 78.3 ng/L in the Pearl River and 23.6 ng/L in the Yangtze.
97 % of the 2,209 registered IMI products in China are formulated for agricultural use; many are still sold as seed coatings -the exact application method banned in Europe because it guarantees near–100 % systemic release into the environment.
Widespread overuse has triggered high-level resistance in numerous pest species, forcing farmers into a toxic treadmill of higher doses and compounded formulations.
IMI now shows near-ubiquitous human exposure: routinely detected in Chinese food, drinking water, indoor dust, and human urine/blood/breast-milk samples.
China remains the global manufacturing powerhouse for imidacloprid, producing 23,000 tonnes annually (2016 figures, likely higher today) –more than the rest of the world combined -while domestic consumption sits at 3,000–4,000 tonnes per year. The researchers conclude that, absent immediate joint action by government, farmers, and scientists (stricter registration rules, enforcement of integrated pest management, and phase-out of seed-coating formulations), imidacloprid will continue contaminating China’s environment and food chain at levels that most developed nations have already deemed unacceptable.
The fact that the EU acted decisively more than six years ago while China still treats IMI as a routine agricultural input lays bare a persistent regulatory double standard that prioritises short-term yield protection over long-term ecological and public-health costs.
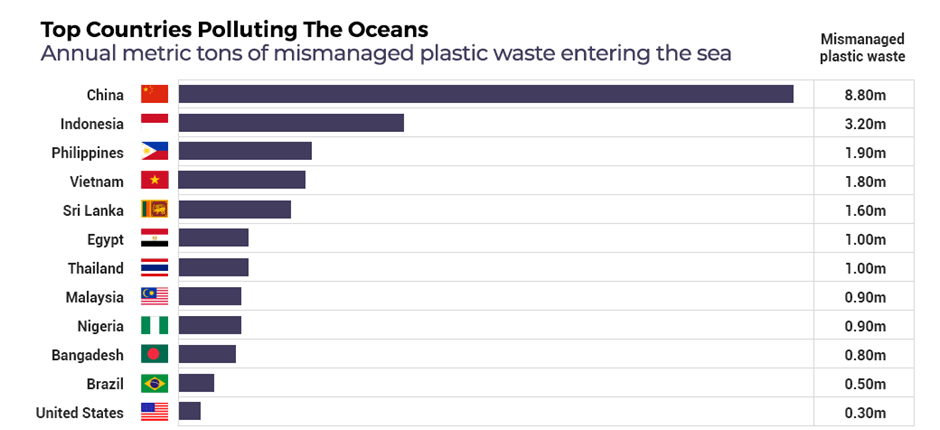
Ocean Pollution
China plays a central, outsized role in global ocean pollution, particularly plastic debris entering the marine environment. Despite recent improvements in waste management, the country remains the top source of mismanaged plastic waste that ultimately reaches the oceans.
Key statistics and impacts (primarily 2020–2025 data)
- China ranks #1 globally for mismanaged plastic waste and total plastic pollution entering the oceans (Jambeck et al., Science 2015; updated estimates in Our World in Data 2024).
- Eight of the world’s top 10 most polluting rivers are in Asia; five are Chinese: Yangtze (Chang Jiang), Yellow (Huang He), Hai He, Pearl (Zhujiang), and Mekong (Lancang). Together with the Indus, Ganges, and others, these rivers account for ~90 % of all riverine plastic flowing into the oceans (https://www.condorferries.co.uk/marine-ocean-pollution-statistics-facts).
- The Yangtze River alone discharges an estimated ~1.5 million tonnes of plastic into the East China Sea annually (historical peak; recent reductions due to waste bans, but still the largest single-river contributor).
- China is the world’s largest producer and consumer of plastics: 29 % of global production, with 1.5–2 million tonnes of plastic waste leaking into rivers and coastal waters yearly (pre-2020 figures; post-2020 estimates ~0.8–1.2 Mt due to improved collection, yet still dominant).
- Microplastics from synthetic textiles (laundry wastewater) and tyre abrasion are major domestic sources; the Pearl River Delta and Yangtze Delta are hotspots for industrial and urban runoff.
- China’s coastal “dead zones” and eutrophication (e.g., Bohai Sea, East China Sea) are exacerbated by nutrient runoff (nitrogen/phosphorus from agriculture) carried by these same rivers, creating hypoxic areas where marine life cannot survive.
Despite the 2018 import ban on foreign plastic waste and aggressive domestic recycling targets, rapid urbanisation, e-commerce packaging growth, and insufficient rural waste infrastructure continue to drive leakage. China’s rivers act as the primary “highway” transporting land-based pollution to the Western Pacific and contributing significantly to the Great Pacific Garbage Patch.
Health Impacts: A Million-Plus Premature Deaths Every Year
China’s industrial-focused growth-particularly between the early 2000s and early 2020s-created a massive, long-term public health burden driven by environmental pollution. Multiple global assessments, including those by the Global Burden of Disease (GBD) program and the World Health Organization (WHO), confirm that more than 2 million preventable deaths occur annually in China due to pollution. Outdoor air pollution alone has been responsible for 1.4–1.85 million deaths each year until at least 2019, making it one of the country’s most lethal risk factors.
Air Pollution (PM2.5, O₃, NO₂, SO₂)
- In 2019, ambient PM2.5 was the third-leading risk factor for premature mortality, contributing to around 1.42 million deaths and more than 33 million DALYs (disability-adjusted life years) lost.
- Total air pollution (indoor + outdoor) causes nearly 2 million deaths annually in China, according to WHO estimates.
- Ground-level ozone (O₃) exposure now contributes to hundreds of thousands of deaths yearly, with severe impacts reported in agricultural regions and confirmed by recent cohort studies.
- After significant reductions in PM2.5 since 2013, research shows life expectancy in northern cities increased by 2–4 years, though the overall national death toll declined only modestly due to ongoing exposure and population aging.
Water Pollution
- Contaminated drinking water and aquatic exposure are linked to 60,000–100,000 premature deaths each year from heavy metals, nitrates, industrial pollutants, and waterborne pathogens.
- Rural communities and regions downstream of industrial zones experience disproportionately high risks, especially where water treatment is inadequate.
Soil Contamination & Food-Chain Transfer
- Government surveys reveal that around 19% of China’s arable land is contaminated with heavy metals.
- Chronic dietary exposure to cadmium, mercury, arsenic, and lead increases risks of kidney disease, developmental disorders, and cancer, particularly in farming regions.
- Although major remediation campaigns began in 2014, legacy contamination remains severe, especially around mining areas and industrial clusters.
Emerging Contaminants
- PFAS (“forever chemicals”), microplastics, and high-toxicity pesticides are now widely detected in drinking water, crops, soils, and human tissues.
- Studies highlight synergistic health impacts, including endocrine disruption, immune dysfunction, developmental toxicity, and long-term metabolic risks.
- China’s 2022 “Action Plan on Controlling New Pollutants” recognizes that emerging contaminants represent the next major environmental health threat.
Vulnerable Populations & Life Expectancy Impact
- Children face the highest relative risks, due to faster breathing rates, developing organs, and increased ingestion of soil and dust.
- During peak pollution years (pre-2013), residents of northern China lost up to 5.5 years of life expectancy from PM₂.₅ exposure alone.
- Achieving WHO air-quality guidelines would yield substantial nationwide gains in life expectancy, though current improvements remain fragile amid industrial pressures, climate extremes, and rapid urbanization.
China’s pollution crisis was not inevitable. Environmental protection was deprioritized in favor of GDP growth for more than a decade, allowing pollution levels to rise to catastrophic levels before emergency reforms were implemented. While air quality has improved in many major cities and life expectancy has recovered slightly, the long-term health burden from contaminated soil, polluted rivers, and bioaccumulated toxins will persist for decades. The human, economic, and ecological costs of these delayed interventions continue to shape China’s public health landscape today.
Since 2015, China has implemented a sweeping overhaul of its environmental governance system—transforming pollution control from a loosely enforced framework into a highly centralized, target-driven regulatory regime. These reforms were designed to reverse the severe environmental degradation resulting from decades of rapid industrialization. While progress is evident in major cities, enforcement gaps continue to challenge the effectiveness of these policies, particularly in rural and interior provinces.
Read about the Pollution Control Measures by China and their impacts in the complete report : Link
Ongoing Challenges
Despite China’s ambitious pollution-control frameworks and high-level political commitment, several structural and systemic challenges continue to hinder meaningful progress:
1. Enforcement Gaps and Local Protectionism
While national regulations have strengthened since 2015, implementation remains uneven. Local governments—often dependent on revenue from polluting industries—frequently delay enforcement, dilute penalties, or overlook violations to protect economic interests. This has resulted in inconsistent pollution reduction outcomes across regions.
2. Industrial Overcapacity and Dependence on Coal
China’s continued reliance on coal—especially in heavy industries like steel, cement, and chemicals—creates persistent air and carbon pollution. Despite the push for cleaner energy, new coal-fired power plants and industrial expansions continue to offset gains from renewable energy.
3. Agricultural Runoff and Rural Pollution
Rural areas remain a blind spot in China’s environmental governance. Excessive use of fertilizers, pesticides, and livestock waste contributes to severe non-point water pollution, yet monitoring systems in rural regions remain underdeveloped.
4. Weak Transparency and Manipulation of Environmental Data
Multiple investigations and independent studies have highlighted systemic opacity in China’s environmental reporting.
- Local authorities have been known to withhold, alter, or selectively disclose air and water quality data to meet political targets.
- The CCP’s tight control over environmental information—including restrictions on research publications and suppression of independent monitoring—makes it difficult for citizens, researchers, and the global community to assess true pollution levels.
- High-profile cases of air-quality data falsification, removal of monitoring equipment, and politically influenced reporting undermine the credibility of China’s environmental progress.
This lack of transparency not only hampers effective policymaking but also signals a deeper problem: environmental governance remains subordinate to political image management.
5. Urban–Rural Inequality in Environmental Protection
Major cities—Beijing, Shanghai, Shenzhen—benefit from advanced monitoring, stricter enforcement, and public pressure. In contrast, smaller towns and inland provinces face weaker oversight, poorer infrastructure, and greater pollution burdens.
6. Slow Progress on Hazardous Chemicals and Soil Pollution
Despite national action plans, contamination from heavy metals, PFAS, and industrial solvents remains widespread. Soil remediation projects are expensive and long-term, leaving millions of hectares of farmland and river basins still at risk.
7. Economic Priorities Often Override Environmental Goals
Periods of economic downturn prompt China to relax pollution controls, accelerate industrial output, or approve new coal projects. This cyclical pattern undermines sustained improvements and casts doubt on long-term commitments to ecological protection.